How It Works
Nothing Performs Like OmniFunds.
Here's Why.
OmniFunds achieve their performance through the use of some very advanced concepts, including...
- Market States
- Filters & Rankers
- Selective Switching
- Multiple Portfolios
Let's look at how these tools are used to craft the best possible Equity Switching Algorithms.
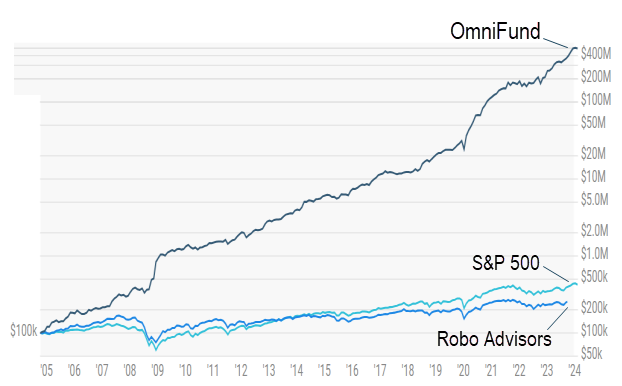
This simulation of the "Highly Diversified" OmniFund shows many times the returns of the Market or the Average Robo Advisor. How is such performance possible?
Market States
Want to Avoid Losses?
Avoid the down markets.
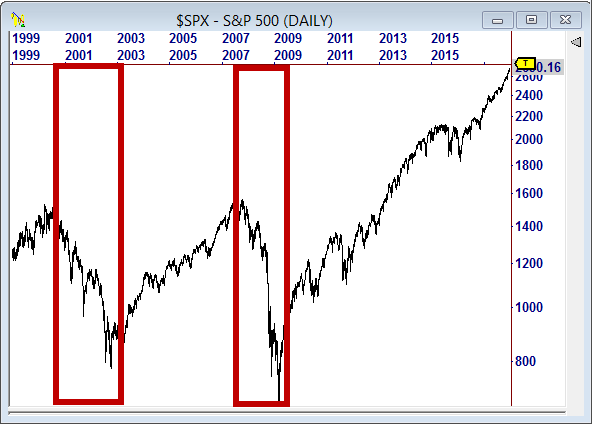
To the left is a chart of the S&P 500 index, representing the US stock market. We have highlighted two periods, 2001 and 2008. Each time, the market declined more than 50%, wiping out years of growth in the process.
Are losses during these periods mostly avoidable? If we can see the market is going down, why wouldn't we close our positions and get back in when the downturn is over? That's the first thing we do to create a robust OmniFund.
Using Market States
Here's the same chart with a Simple 100 Period Moving Average. If the index is above the average, the market is generally bullish (green zone) and new Long Positions can be engaged. If it's below the average, the market is bearish (red zone) and we should exit Long positions.
While the Market States used in our Omnifunds are more sophisticated, we can see that even using a Moving Average is better than just owning stocks at all times - like Advisors, and especially the Robo Advisors do.

Weekly Chart of the S&P 500
Filtering & Ranking
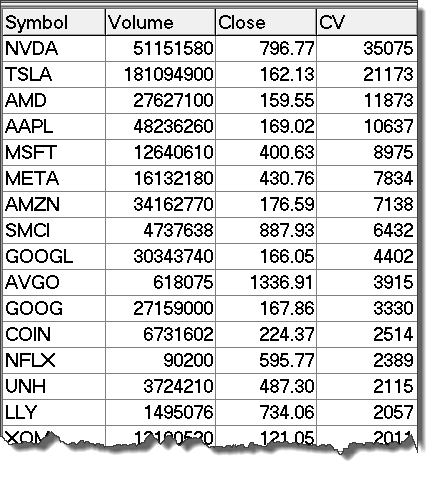
The most liquid stocks in May of 2024.
The CV Column is Price * Volume, in $ Millions.
Start with a Good List
There are over 10,000 equities in the U.S. Stock Market. Many of them are not "liquid" enough to consider as investments.
The best liquidity filter is Money Flow, which is calculated as Average Price * Volume. Most of our OmniFunds have a lower limit on Money Flow of $100 million. So a $100 stock must trade an average of 1 million shares a day to qualify.
A single Portfolio may include stocks from a specific index, like the NASDAQ 100, or a given industry, such as Technology or Healthcare.
Filtering the List
While Liquidity is very important, we also look at factors that indicate a stock's probability of rising, including both chart and fundamental measurements. Some of these include:
- Recent Earnings
- Momentum
- General Trend
- Volatility
- and more..
We apply these Filters to get candidates that have "the right stuff" to consider for Opportunity Ranking.


Opportunity Ranking
We want to invest in stocks that have the highest probability of upward price movement. For example, we can sort our candidates from highest Momentum to lowest to arrive at the Top 10 Candidates.
The OmniFund Filtering and Ranking process ensures that we are selecting those securities that should appreciate the most in the upcoming interval.
Selective Switching
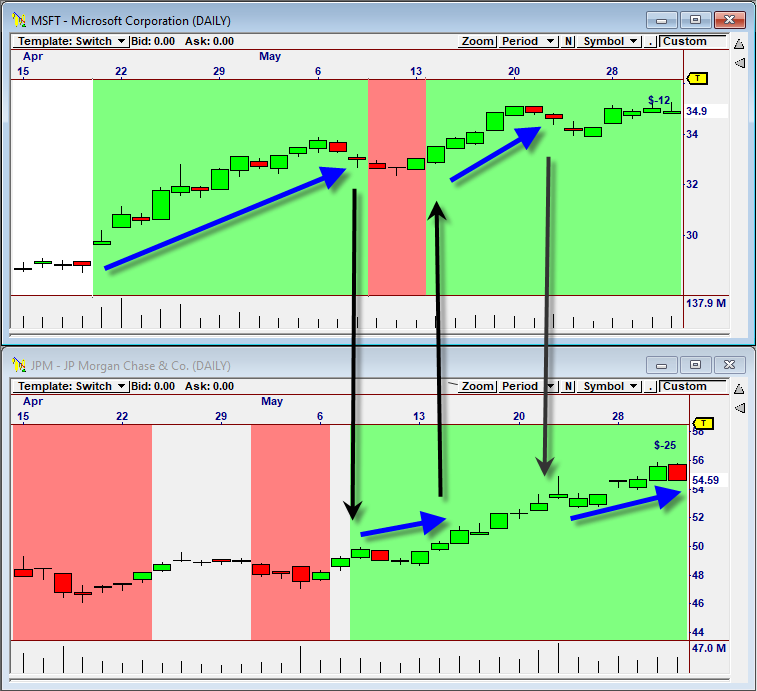
The Selective Switching Process
at the Portfolio Level
After applying Market States, Filtering and Ranking in a Portfolio, OmniFunds compares the Ranks with stocks that are already in the Portfolio, to see if any have a higher Rank. If so, it replaces them.
As shown in a hypothetical switching scenario, MSFT and JPM switch places as the rank of one takes the lead position over the other. By trading MSFT in April, the portfolio grows more rapidly than if both MSFT and JPM had been traded at the same time.
This is the advantage of OmniFunds vs. most Advisors, and especially Robo Advisors. We never trade an index. We trade the strongest stocks in the index.
Combining Portfolios
for Added Diversification
Using Multiple Portfolios
to Create a Diversified OmniFund
The design and selection of each Portfolio is made by the designer who created it. Custom Symbol Lists, Market States, Filtering and Ranking combine to arrive at a final list of stocks for which positions should be held that represent each individual Portfolio.
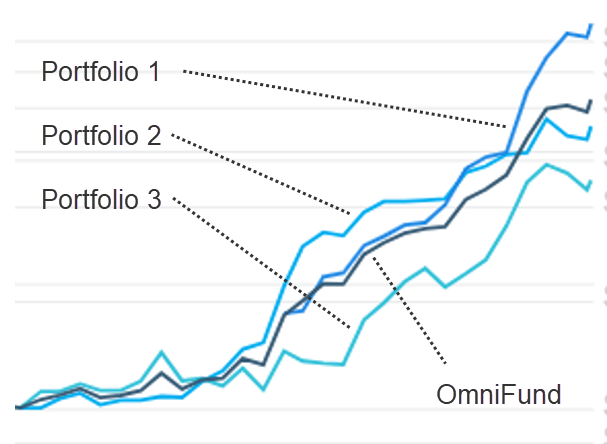
But OmniFunds are typically constructed using multiple Portfolios. The picture to the right shows three Portfolio performance curves. To create the OmniFund, 33% of the available capital is allocated to each one.
The stocks traded in the OmniFund are the stocks selected by each Portfolio. If a Portfolio does not have any candidates, its allocation is set to "cash".
This website is operated and maintained by Intelligent Fund Management LLC. Brokerage services provided to clients of Intelligent Fund Management LLC by Gar Wood Securities, an SEC registered broker-dealer and member FINRA/SIPC. Investments: Not FDIC Insured • No Bank Guarantee • May Lose Value. Investing in securities involves risks, and there is always the potential of losing money when you invest in securities. Before investing, consider your investment objectives and OmniFund’s charges and expenses. Past performance does not guarantee future results, and the likelihood of investment outcomes are hypothetical in nature. See full disclosures for more information. Not an offer, solicitation of an offer, or advice to buy or sell securities in jurisdictions where OmniFunds is not registered. Contact: Intelligent Fund Management, 9111 Jollyville Rd, Suite 26, Austin, TX 78759. Tel: 800-880-0338
