Recent History & New Developments
for 2025 and Beyond.
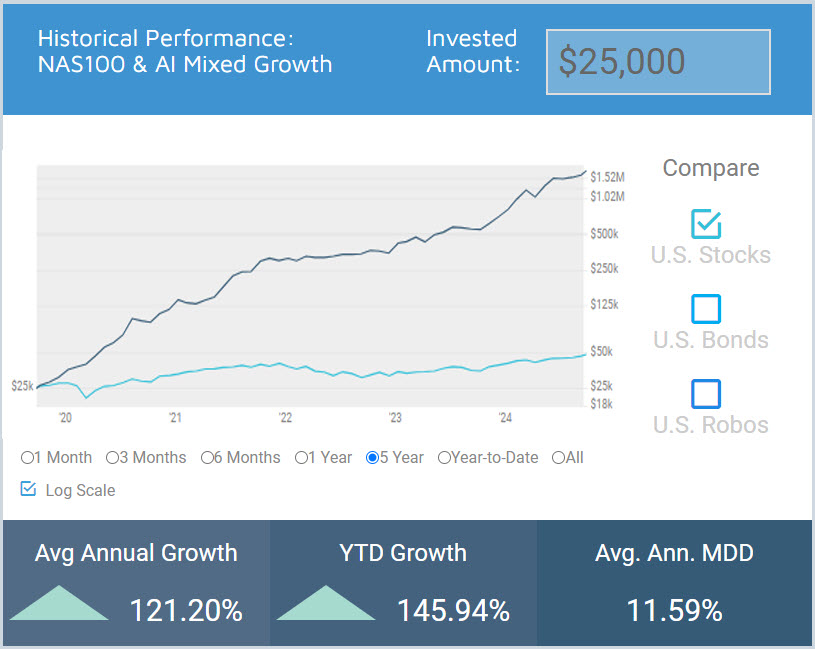
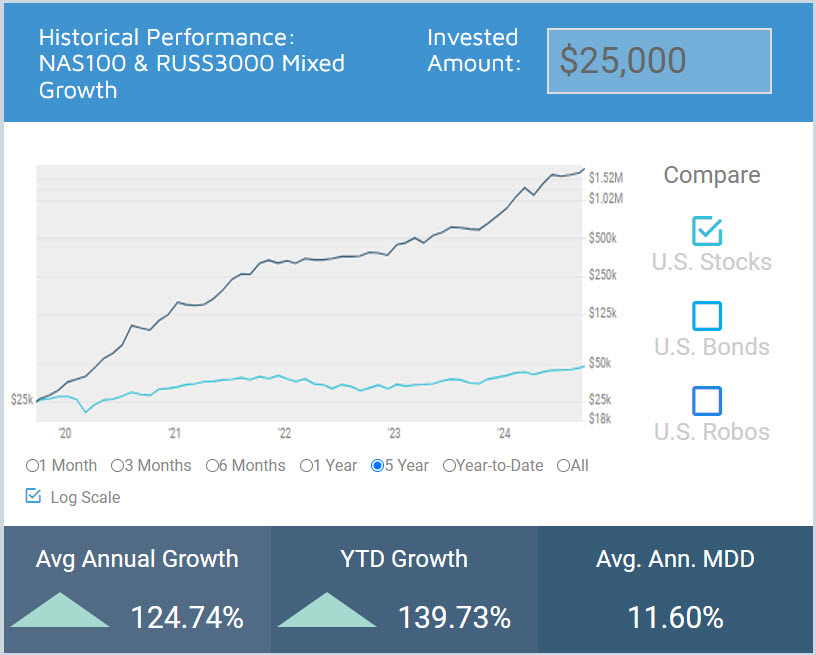
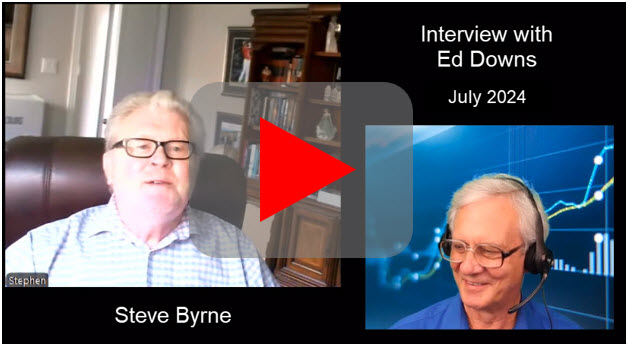
OmniFunds v2 was released in July 2024. From there through December, they outperformed the Market by as much as 8-to-1 in live trading. I've interviewed a number of OmniFunds customers, including Nick Wold, who gained 87% in his margin account from August to December. Watch Interview
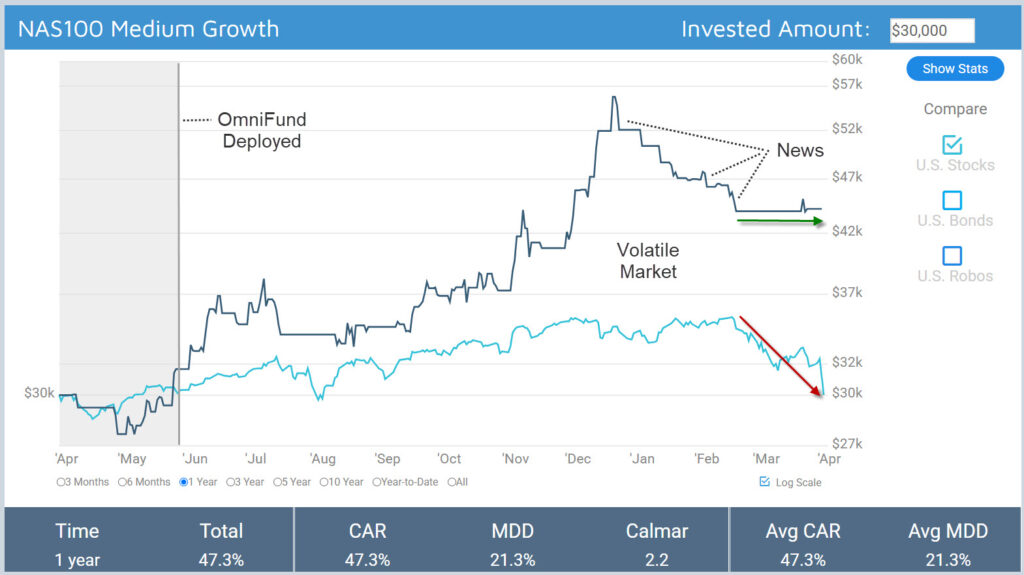
Most Version 2 OmniFunds are positive since they were deployed. For example, NAS100 Medium Growth, shown above, is up 47%. However, the market hasn't fared so well. As of today, the S&P 500 is negative and shows signs of going lower. We are clearly in a Bear Market.
When you're investing, staying out of harm's way is almost as important as making gains. OmniFunds' goal is to engage the Bull Markets and avoid the Bear Markets. The Good News? All our OmniFunds have been in cash throughout the decline, awaiting The Return of The Bull.
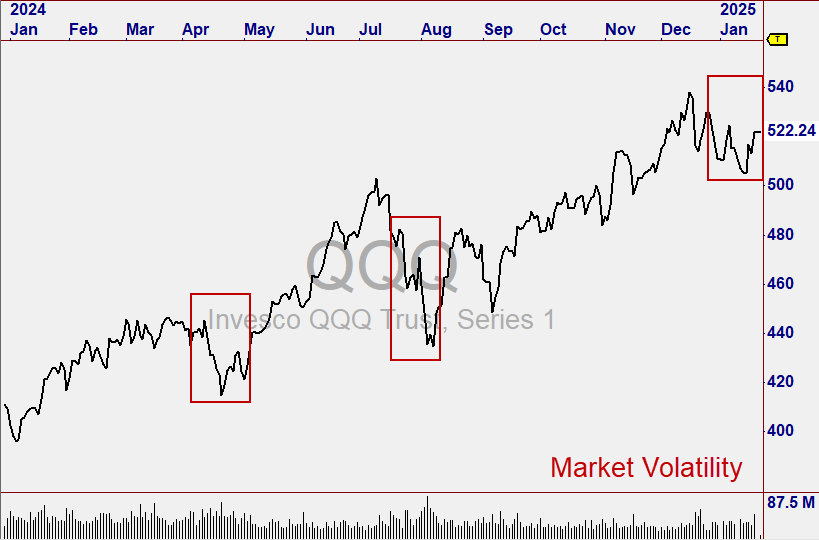
A Volatile Market in Q1 of 2025
From December 18 to present, the Market went through a series of unusual market events which are listed below.
- Fed Funds Announcement - On December 18, The FED held an FOMC meeting, implying it was unlikely to lower rates any time soon. The Market dropped 3.5%.
- Up 4, Down 4, Repeat - In early January, the NASDAQ went into a "Cyclical Mode" where it gained several percent over 3-4 days, only to turn down to where it started in the same amount of time, several times. Our Researcher implemented a way to detect this so OmniFunds can go to cash should this occur in the future.
- Chinese AI? - On Sunday, January 23, news coming from China indicated the Chinese had built a superior A.I. at a fraction of the cost. This announcement caused NVDA and AVGO to drop 18% each Monday morning. We were in AVGO.
- Tariff Announcement - As the political climate heated up with uncertain news surrounding Tariffs and other events, the Market became unstable, going into a free-fall on February 21 and losing over 22% by April 4.
Counter-Measures
I put my wife's retirement account in this OmniFund on January 28, and since then she's had about a 2% Draw Down and is up about a percent as of April 4.
After the market began showing heightened volatility, we issued posts in our private OmniFunds Circle Community*, suggesting that users reduce allocation and/or switch into less-aggressive OmniFunds, like Safe Harbor Diversified Low Draw Down.
Log in with your MyOmniFunds login & click the OmniFunds News link on the left.
Using AI to Trade Bear Markets
- Avoid Bear Markets by Moving to Cash
- Take Full Advantage of Bull Markets
Rather than move to cash in down markets, users have asked if there is a way our OmniFunds can make money in market declines. The answer is yes, with Inverse ETFs, Defensive Stocks, and AI-Generated Market States.
Trading Inverse ETFs
Inverse ETFs go the opposite direction of a target Index ETF. For example, SPY is the most liquid ETF representing the S&P 500. The inverse ETF, SH, moves precisely the opposite to SPY. So, in a down market, we can buy SH.
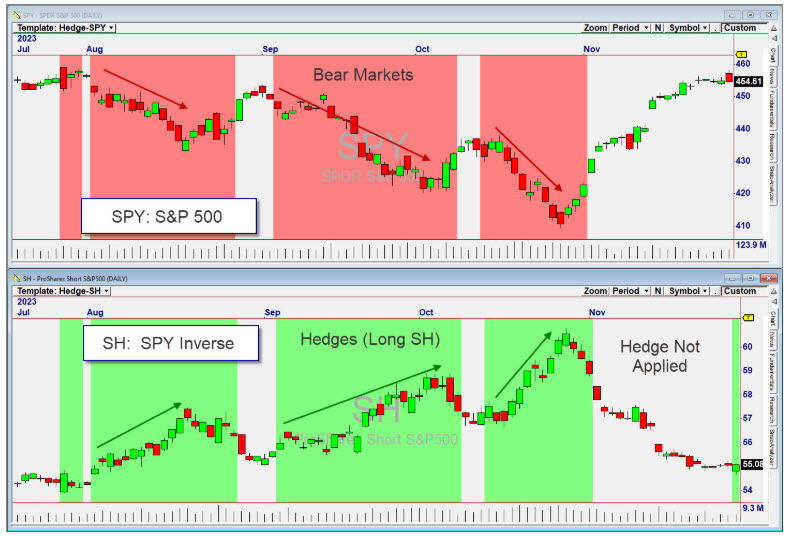
The only problem with doing this is the market is upward-biased, so we must be relatively certain it's headed south before we buy the inverse.
We have been using Artificial Intelligence to build hedge methods that purchase inverse ETFs alongside Long positions in stocks when weakness enters the market. This protects the positions from further downside movement. Of course, if the market keeps going down as it recently did, the hedge can generate significant profits.
Results so far are very promising, and I expect to make an announcement in April about our findings and ideally, the deployment of new Portfolios that implement the hedge.
AI-Generated Defensive Stock Lists
Defensive Stocks are stocks that are mostly impervious to market corrections, like staples drugs, and utilities. They are often purchased as a hedge against Bear Markets.
Procter & Gamble (PG)
Campbell's Company (CPB)
Constellation Brands (STZ)
Brown-Forman Corporation (BF.B)
GSK (GSK)
West Pharmaceutical Services (WST)
Coloplast (CLPBY)
Zimmer Biomet Holdings (ZBH)
Danaher (DHR)
Ambev (ABEV)
We are harnessing the power of Artificial Intelligence to build these historical defensive stocks lists over the past and apply our Algorithms to them.
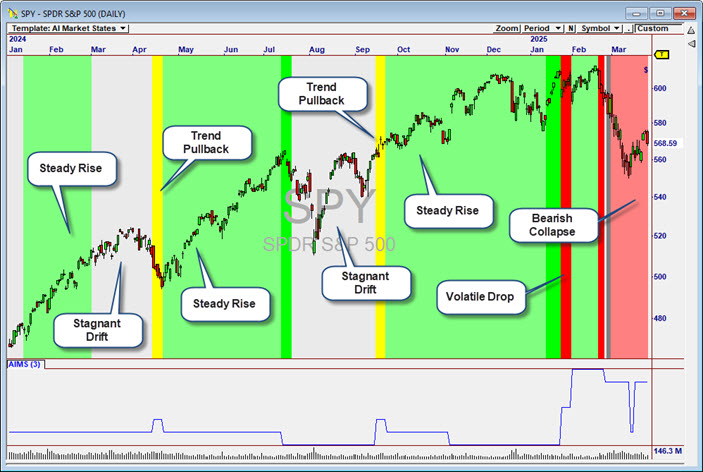
AI-Generated "Market States"
We are also using building intelligent Market States (Likely to Trend, Likely to Decline, etc.) that identify weak, strong and sideways markets. Here is a screen shot of the new Market States we arrived at last week, 100% generated by generative AI on our servers.
Awaiting The Return of The Bull
Here at Nirvana Systems, we are never "done" improving improving our products, and OmniFunds is no exception. That's why your OmniFunds investment will continue to grow in value. As the Market has declined, our researchers have been hard at work on the additional enhancements discussed above.
We expect the current research to yield robust Portfolios we can add to OmniFunds this month (April). We will keep subscribers updated in our OmniFunds Circle Community. The economy may be rather unpredictable right now, but I personally believe 2025 is going to end up as an incredible year for stocks. The Bull has always come back.
Ed Downs
CEO, Nirvana Systems, Inc.

