OmniFunds vs. the Robo-Advisors
OmniFunds vs. the Robo-Advisors
Do Robo-Advisors Beat the Market?
The Short Answer
is NO!
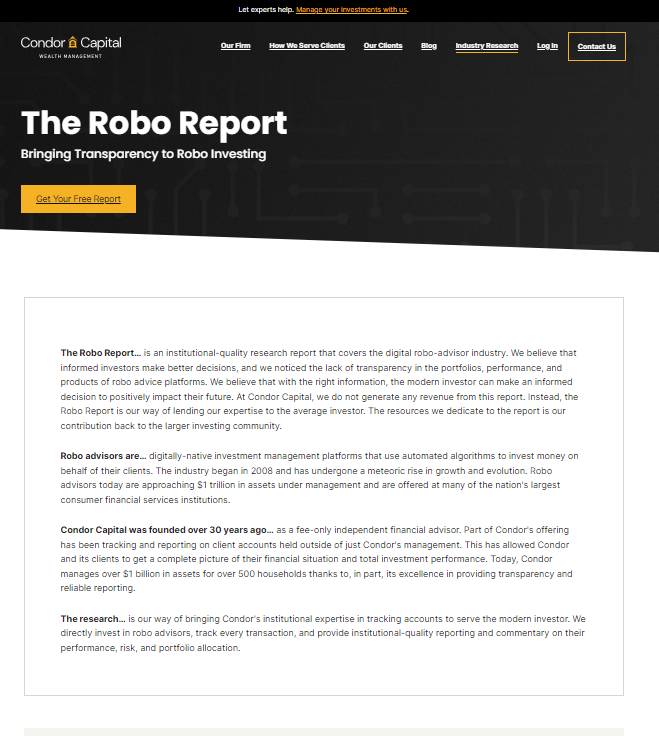
Every quarter, Condor Capital Wealth Management publishes The Robo Report, documenting the 1-year, 3-year, 5-year and YTD performance of the most popular Robo-Advisors. The top of the summary page is shown here.
For the 5 Years ended March 30, 2024 the average Robo Advisor return was 6.5%. Over the same amount of time, the average market return as measured on the DJIA was 14%. That's DOUBLE the return of the average Robo Advisor in this time.
The simulated performance of one of our OmniFunds as of 6/1/24 is shown to the right.
Average Robo Advisor Return:
7% per year
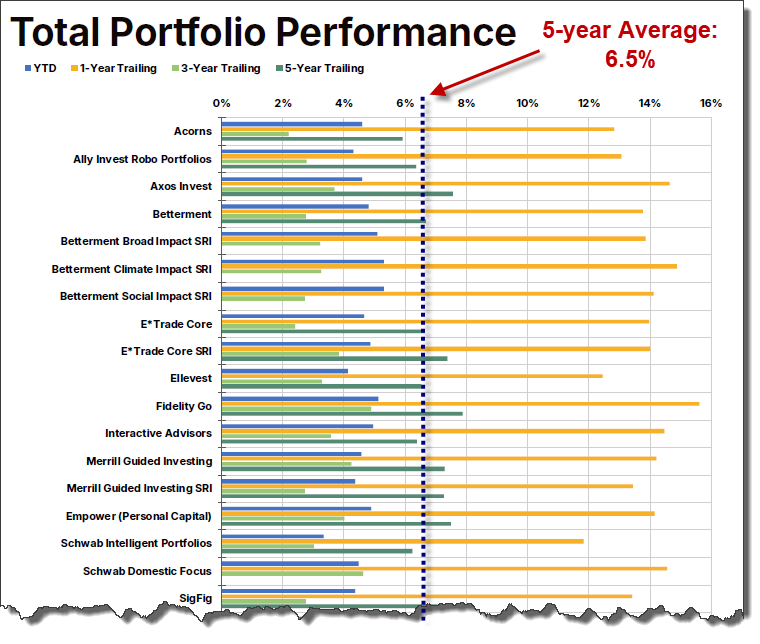
Source: The Robo Report published at the end of Q1 2024.
Click here for the Robo Report Archives.
Average Market Return
14% per year
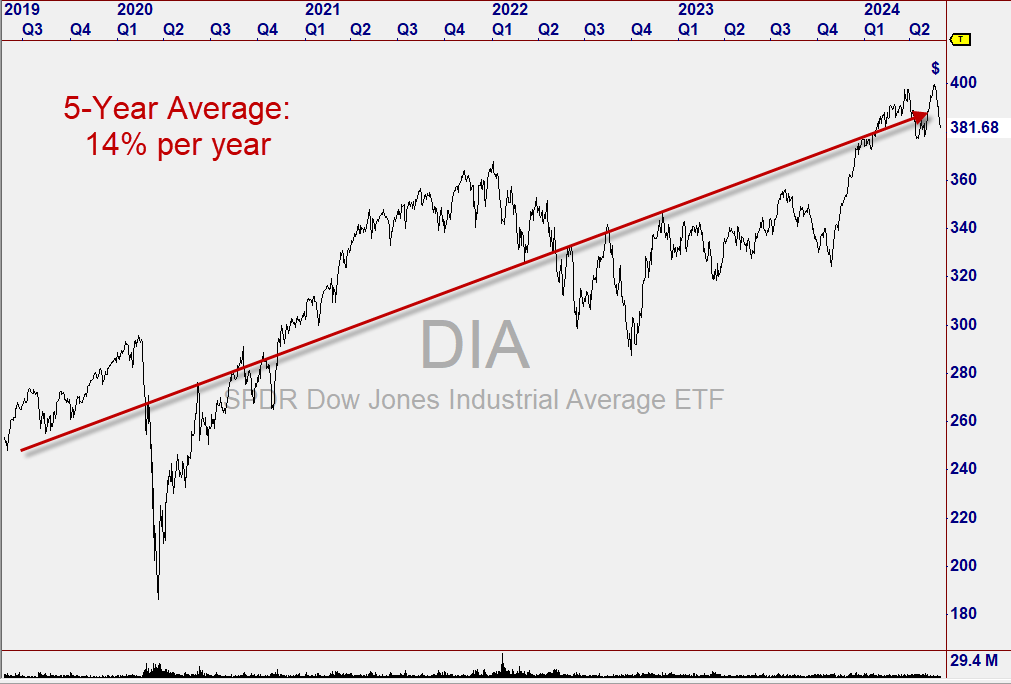
5-Year chart of the Dow Jones Industrial Average.
"Highly Diversified" OmniFund Return
66% per year *
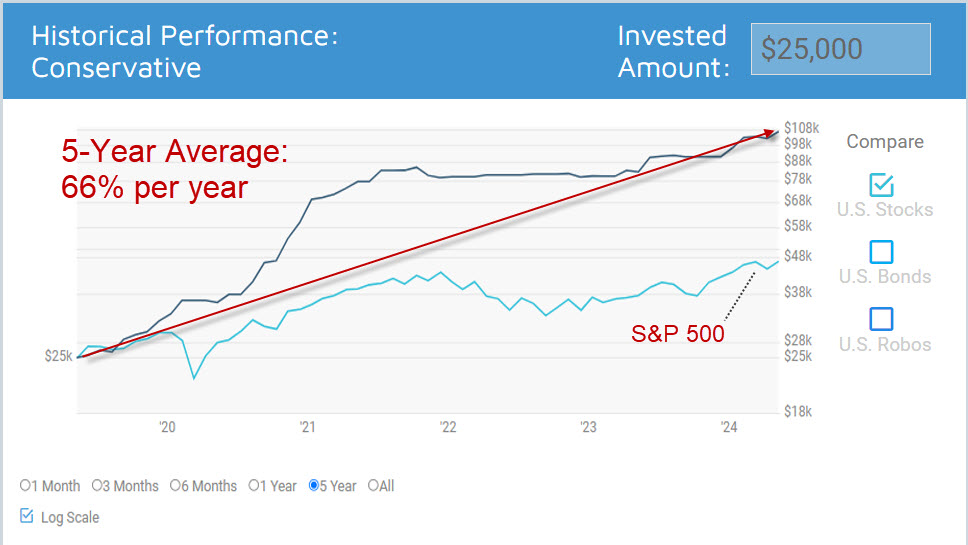
* The Highly Diversified OmniFund was deployed 5/1/2024. This chart shows simulated performance from 6/1/2019 to 6/1/2024 of 66% per year.
Wondering How Robo-Advisors Are Actually Performing in 2020?
The verifiable Robo-Advisor return data seems to be a very closely guarded secret. Try your own search for the answers and see just how little actual evidence you can find.
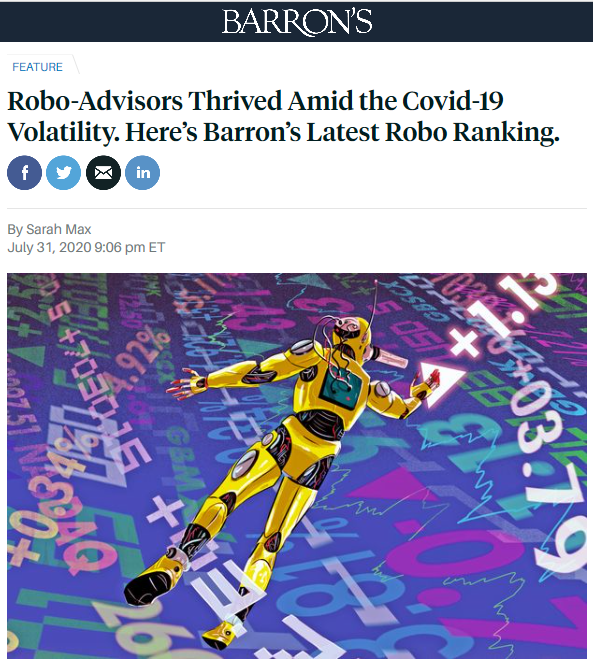
Every quarter a company called Backend Benchmark produces a report on the actual return of several prominent robo-advisors. Barron's recently published an article with a sneak peak of the evidence for 2020. What we find interesting is the title of the article exclaims that robo advisors are thriving during Covid...but only ONE robo advisor on the list of 10 had a positive return for the first half of 2020 at a microscopic +0.4% while the biggest loser is down -5.4%.
Read for yourself - Here
We Read the Full Report and Found More Interesting Details...
If you just look at annualized returns for 2.5 years, it shows most of the Robo-Advisors up ranging from about 1% to a max of 4.7%.
Looking at the entire list, only a handful had positive returns in 2020. The vast majority
of all Robo-Advisors, according to the report, are down, and down significantly in 2020.
Even if you pile in more data, going back years, the Robo-Advisors only produce a few percentage points of growth.
Over and over again the Robo is down badly in 2020, with a 4% to 8% +/- return in the years prior.
Don't Take Our Word For It...You Can Read The Report Too!
OmniFunds is the product of over 30 years of research and development into market trading automation. This is the fundamental difference. Based on our experience developing and providing indicators, systems and strategies for individual investors, we believe you CAN time the market. And we are proving that tenet to be true every day. OmniFunds doesn't trade the headlines or the latest financial news. It allocates to resources poised to outperform - and switches to safer assets when necessary - using cutting edge technology. OmniFunds is better than a Robo-Advisor in so many ways. Call us, we would love to have a conversation about how our technology can benefit you.
Why Robo Advisors Under-Perform
In 2013 Robo-Advisors Began Appearing
on the Investment Landscape.
For the first time in the history of investment advisory services, investors began placing their funds to be managed by algorithms run by computers.
Since the first Robo-Advisor came on the scene, many more have been introduced. All of them use the same concepts.
The Robo-Advisor Philosophy:
> You can't time the market
> The best you can do is diversify and try to get market returns.
> Low cost is what investors want. Returns are secondary.
We disagree with all these points and will show why, after we tell their story.
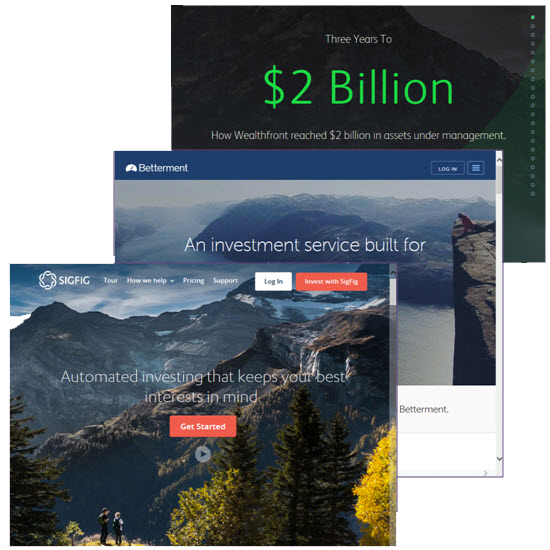
Robo-Advisors Use ETFs to Manage Customer Accounts.
Exchange Traded Funds or "ETFs" are securities composed of many stocks. The advantage is, they trade as a single security.
ETFs are the ideal investment vehicle. They exist for all major sectors of the market, including Bonds, Foreign investments, Currencies and other Commodities.
However, ETFs are also "watered down" because high levels of diversification result in a "average move". At OmniFunds, we have discovered that higher returns can be achieved with less risk by investing in leading stocks, and using additional tools to avoid the down markets. But that story is coming up...
The Robo-Advisor Approach
Robo-Advisors use something called "Modern Portfolio Theory" or MPT, to allocate resources across different ETFs. It's not that modern though - the paper on which MPT is based was published in 1953 - over 70 years ago.
The Robo Advisors say they get superior results by applying a technique called "Rebalancing", which is an attempt to Buy Low and Sell High: If an ETF LOSES value, the Robot buys MORE of it. If an ETF gains in value, the Robot sells a portion of it. But what if an ETF keeps going down, as in 2008? The Robo Advisor just keeps buying more of it!
They claim this "Re-Balancing" adds 0.6% to annual return. So, even by their calculation, the effect is not significant in terms of total return.
How it Worked out
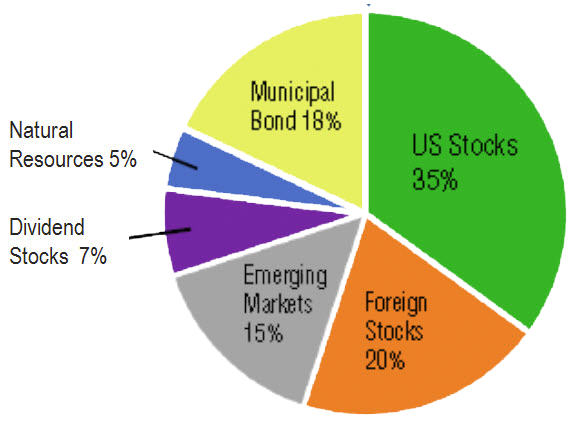
To the right is a Portfolio by Wealthfront that was recommended in 2015 - their "taxable account".
You can see the different ETFs representing U.S. Stocks, Emerging Markets, etc. with their allocations in an account. These ETFs were chosen according to the tenets of Modern Portfolio Theory.
Now, look at the results one would have seen in their account from January 1 through October 1, 2015.
The problem with MPT is that when the market goes down, virtually all the ETFs recommended by MPT also go down.
That's not very "risk-averse". As long as the market goes up, MPT can yield positive returns. But in a down market, the returns can be more than disappointing.


IBotson's Published Record
IBotson provides the Robo-Advisor system (software) that most firms rely on.
Here is THEIR published record, including a "back test" created ahead of their public launch. The back test is labeled as "HISTORICAL" in this chart, which ends October 2015.
The white line represents the market. It's easy to see that, If you had just bought one ETF, "SPY", which represents the S&P 500, you would have been up 10% over using the MPT approach!
In 2013 Robo-Advisors Began Appearing
on the Investment Landscape.
For the first time in the history of investment advisory services, investors began placing their funds to be managed by algorithms run by computers.
Since the first Robo-Advisor came on the scene, many more have been introduced. All of them use the same concepts.
The Robo-Advisor Philosophy:
> You can't time the market
> The best you can do is diversify and try to get market returns.
> Low cost is what investors want. Returns are secondary.
We disagree with all these points and will show why, after we tell their story.

Robo-Advisors Use ETFs to Manage Customer Accounts.
Exchange Traded Funds or "ETFs" are securities composed of many stocks. The advantage is, they trade as a single security.
ETFs are the ideal investment vehicle. They exist for all major sectors of the market, including Bonds, Foreign investments, Currencies and other Commodities.
ETFs are the investment vehicle of the future!
The Robo-Advisor Approach
Robo-Advisors use something called "Modern Portfolio Theory" or MPT to allocate resources across different ETFs. To be clear, the paper on which MPT is based was published in 1953. How modern is that?
The Robos say they get superior results by applying a technique called "Rebalancing": If an ETF LOSES value, the Robot buys more of it. If an ETF gains in value, the Robot sells a portion of it - an attempt to Buy Low and Sell High. But what if an ETF keeps going down, as in 2008? The robo advisor just keeps buying more of it!
The Robo-Advisors say this "Balancing" adds 0.6% to annual return. So, even by their calculation, the effect is not very significant in terms of total return.

How it's Worked out
Below is a Portfolio by Wealthfront that was recommended in 2015 - their "taxable account".
You can see the different ETFs representing U.S. Stocks, Emerging Markets, etc. with their allocations in an account. These ETFs were chosen according to the tenets of Modern Portfolio Theory.
Now, look at the results one would have seen in their account from January 1 through October 1, 2015.
The problem with MPT is that when the market goes down, virtually all the ETFs recommended by MPT also go down.
That's not very "risk-averse". As long as the market goes up, MPT can yield positive returns. But if the market goes down - the result can be more than disappointing.

IBotson's Published Record
IBotson provides the Robo-Advisor system (software) that most firms rely on.
Here is THEIR published record, including a "back test" created ahead of their public launch. The back test is labeled as "HISTORICAL" in this chart, which ends October 2015.
The results are surprising. If you had just bought one ETF, "SPY", which represents the S&P 500, you would have been up 10% over using the MPT approach!
The OmniFunds Approach
We use Technical Indicators to determine Market State.
Then we select those stocks that are most likely to appreciate, while ALSO examining WHAT THE MARKET IS DOING and adjust holdings based on that - or going to Cash.
Makes sense, right? If the market is BULLISH, you want to be LONG Equities. But if it turns sideways, becomes volatile or starts moving down, you should be in Cash and potentially, defensive assets like Gold, or even Inverse ETFs.
So, rather than switching into ETFs that are going down each month, we look for the best stocks each DAY and use Market State to avoid the down markets.
Selective Switching, aligned with Market State is the Fundamental Difference.

Based upon our 30 years of experience developing and providing indicators, systems and strategies for individual investors, we believe you CAN time the market. And we are proving that tenet to be true every day.

Higher Returns. Less Risk.
This OmniFund beat the Robo-Advisor index by a factor of 4, with draw downs reduced by half, yielding an overall improvement of 800%.
The only way to get these results is by switching into assets that have the highest probability of appreciation as a result of proprietary analysis.
Switching vs. Buy and Hold
The average Robo Advisor will keep you invested in a very specific mix of ETFs, which will almost always follow the market down. Many of them have a vested interest in using specific funds (like the Vanguard ETFs) which is good for them, but in our opinion not so great for the investor.
Switching into different equities or ETFs periodically does incur commission cost, but staying aligned with the Market's "Personality" and trading into the strongest securities or ETFs on a periodic interval can generate much greater returns and avoid large draw downs. It is not what you save, but what you take home that matters! Returns Matter.
It’s All About Higher Returns With Less Risk. That’s The OmniFunds Goal.
Returns Matter.
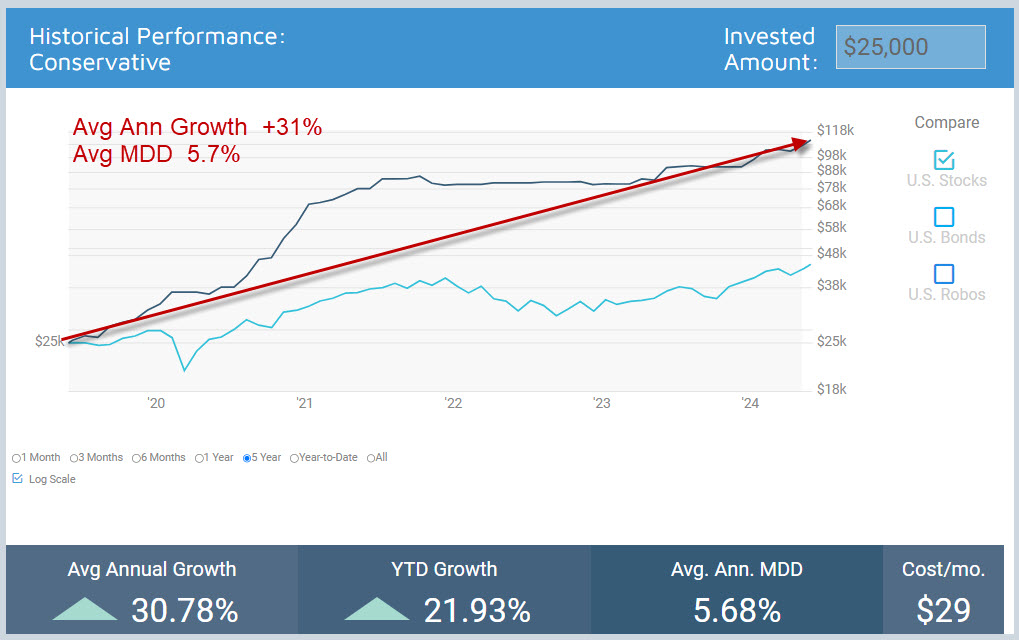
* Simulated 5-Year performance of the Conservative OmniFund on June 20, 2024.
The Conservative OmniFund
June 1, 2024
For the 5 years from June 20, 2019 to June 30, 2024 our Conservative OmniFund averaged an annual (simulated) return of 31% with an average max draw down under 6%.*
Compare that to Robo Advisor returns of just 6.5% over the same period, with much higher draw downs.
Using the Right Broker is Also Important to Overall Performance.
Our built-in broker, Gar Wood securities, clears through Interactive Brokers. Because of I.B.’s low commission structure, the cost of switching between securities can be as low as ½ cent per share. Other brokers SAY they don't charge commissions, but they charge other fees, including "order flow", which actually results in more cost than commissions!
The OmniFunds Approach
We use Technical Indicators to determine Market State.
Then we select prudent mixtures of assets (ETFs) based on measuring the INTERNAL component stocks, and other methods.
The idea is simply to LOOK AT WHAT THE MARKET IS DOING and adjust holdings based on that.
Makes sense, right? If the market is trending up, you can be LONG Equities, Bonds, and Foreign Stocks. But if it turns sideways, becomes volatile or starts moving down, you should be in Cash and defensive assets, like Gold. Or even Inverse ETFs, which we will discuss shortly.

This is the Fundamental Difference.
Based upon our 30 years of experience developing and providing indicators, systems and strategies for individual investors, we believe you CAN time the market. And we are proving that tenet to be true every day.
Higher Returns. Less Risk.

This OmniFund (Global Investment) beats the Robo-Advisor index by a factor of 4, with draw downs reduced by half, yielding an overall improvement of 800%.
The only way to get these results is by doing the following on a periodic interval (typically one month):
· Analyzing the personality of the market and selecting classes of securities that align with the market.
· Switching into the securities with the highest potential for appreciation according to our proprietary Probability Analysis.
Switching vs. Buy and Hold
The average Robo Advisor will keep you invested in a very specific mix of ETFs, which will almost always follow the market down. Many of them have a vested interest in using specific funds (like the Vanguard ETFs) which is good for them, but in our opinion not so great for the investor.
Switching into different equities or ETFs periodically does incur commission cost, but staying aligned with Market's "Personality" and trading into the strongest securities or ETFs on a periodic interval can generate much greater returns and avoid some of the really large draw downs typically seen. Returns do Matter. It is not what you save, but what you take home!
It’s All About Higher Returns With Less Risk. That’s The OmniFunds Goal.
Using the Right Broker is Important to Overall Performance.
Our built-in broker, Gar Wood securities, clears through Interactive Brokers. Because of I.B.’s low commission structure, the cost of switching between securities can be as low as ½ cent per share. All other mainstream brokers charge between $5 and $10 a trade, which can be much higher depending on trade size.
The Perfect
Combination.
OmniFunds is the perfect combination of Analysis & Technology with one of the lowest cost Broker connections. Track our OmniFunds and experience the OmniFunds Difference for yourself!
This website is operated and maintained by Intelligent Fund Management LLC. Brokerage services provided to clients of Intelligent Fund Management LLC by Gar Wood Securities, an SEC registered broker-dealer and member FINRA/SIPC.Investments: Not FDIC Insured • No Bank Guarantee • May Lose Value. Investing in securities involves risks, and there is always the potential of losing money when you invest in securities. Before investing, consider your investment objectives and OmniFund’s charges and expenses. Past performance does not guarantee future results, and the likelihood of investment outcomes are hypothetical in nature. See full disclosures for more information. Not an offer, solicitation of an offer, or advice to buy or sell securities in jurisdictions where OmniFunds is not registered. Contact: Intelligent Fund Management, 9111 Jollyville Rd, Suite 26, Austin, TX 78759. Tel: 800-880-0338
Enter your text here...

